
The following charts were made in Microsoft Excel using data freely available to the public from the FBI Uniform Crime Reports.
Click each chart for a larger version.
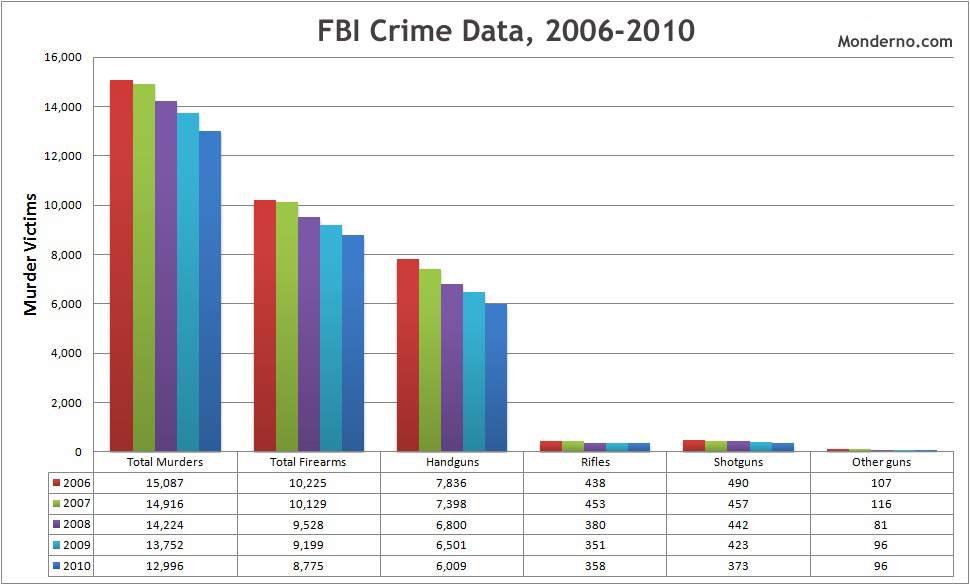
FBI Crime Data, murder by weapon, 2006-2010
This chart shows the distribution of murders by weapon for 2006 through 2010. Interesting to note is that semiautomatic rifles, like the AR-15, would be a subset of the Rifles category.
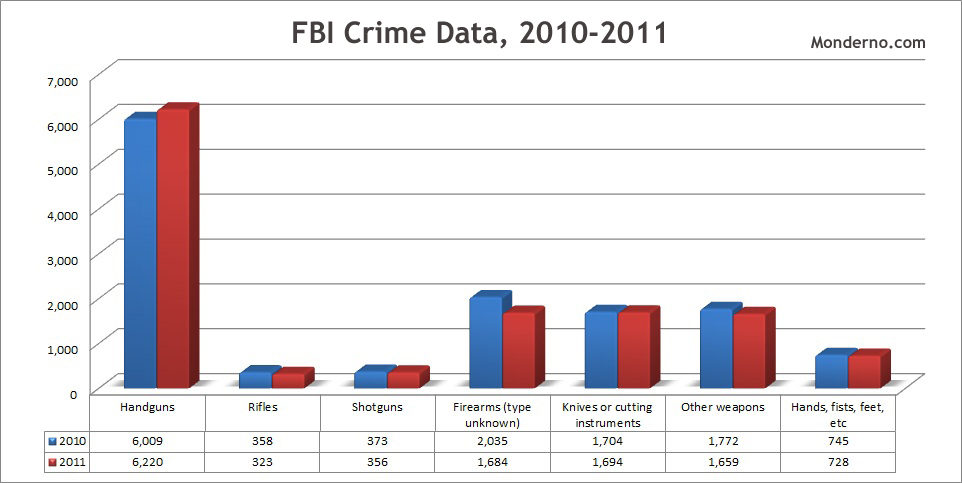
FBI Crime Data, murders by weapon, 2010-2011
This chart shows the distribution of murders by weapon for 2010 and 2011. Interesting to note is that semiautomatic rifles, like the AR-15, would be a subset of the Rifles category.
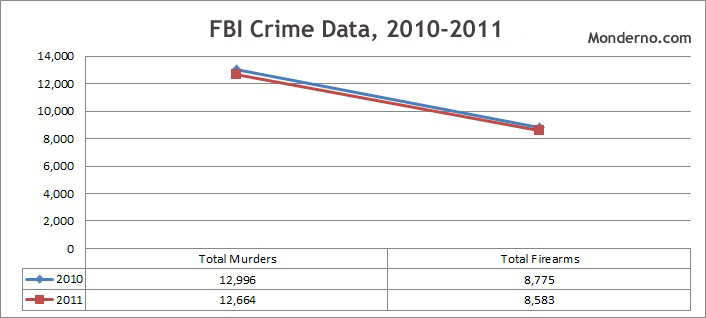
FBI Crime Data, 2010-2011
This chart shows the downward trend of total murders and murders committed by firearms recent years.

FBI Crime Data, 2011
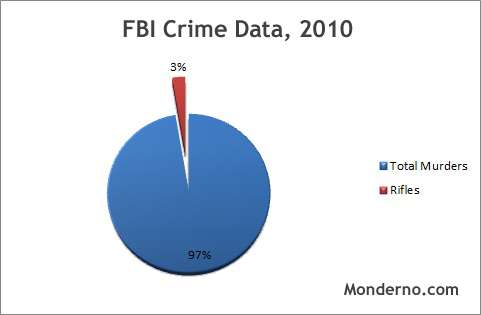
FBI Crime Data, 2010
These charts show the percentage of murders committed by rifles in 2010 and 2011. Interesting to note is that semiautomatic rifles, like the AR-15, would be a subset of the Rifles percentages.